The Material ECA Solver | Fast and Accurate Assessment of Critical Flaws

In This Article
The Material ECA Solver calculates the line on a Flaw Height vs Flaw Length chart separating flaws that are acceptable from those that are not acceptable. Flaws along this line are Critical Flaws. When fracture, fatigue, and/or ductile tearing components are chained together to represent a time period such as a lifetime, the Solver produces a list of Critical Initial Flaws. The energy and offshore industries use these Critical Flaws and Critical Initial Flaws for several reasons, primarily to form the technical basis for NDE requirements during fabrication or construction of fracture and fatigue critical items.
This article demonstrates and describes the Solver. It includes the following topics:
- Running the Solver and Viewing the Results
- Running the Solver for Corner Flaws in Plate and Straight Flaws in Rounds
- Running the Solver for Embedded Flaws
- Exporting Solver Results as an Excel File
- Exporting Solver Results as a JSON File
- How the Solver Works
- A Discussion About Non-Unique Solutions and Other “Odd Solver Results”
In this article the Solver is run on Fracture Components; however, it runs the same way and produces the same result format for all Component Types: Fracture, Fatigue, Tearing, Chain, and Group. In addition, the Solver runs the same way and produces the same result format for all Geometry Types, except for corner flaws in plate (Plate Corner) and straight flaws in round sections (Round Straight). This consistency makes the Material ECA Solver easy to understand and use.
The following figure is a typical Solver Result chart: Flaw Height vs Flaw Length. It shows the results from the assessment of more than 3000 flaws. The Critical Flaws are those along the line separating the acceptable flaws from not acceptable flaws. These are calculated to an accuracy of 0.001mm in a range of flaw ratios (Flaw Length to Flaw Height) between 2 and 100.
The Solver can be run in Normal or High Resolution. In Normal Resolution, Material ECA calculates a list of 25 Critical Flaws, and in High Resolution, Material ECA calculates a list of 100 Critical Flaws. A priority of the Material ECA Solver is to identify the smallest flaws that are Not Acceptable. These are the flaws that must be detected as part of NDE programs and addressed as part of fitness-for-service (FFS) and ECA assessments. The chart includes the flaws in the Acceptable region to demonstrate the validity of the Critical Flaws – there are no Not Acceptable Flaws smaller than the Critical Flaws.
The Solver Results can be exported in two ways: as a Microsoft Excel file or as a JSON file. Both contain data associated with every flaw assessed for further processing, as desired, and will be described in more detail later in this article.
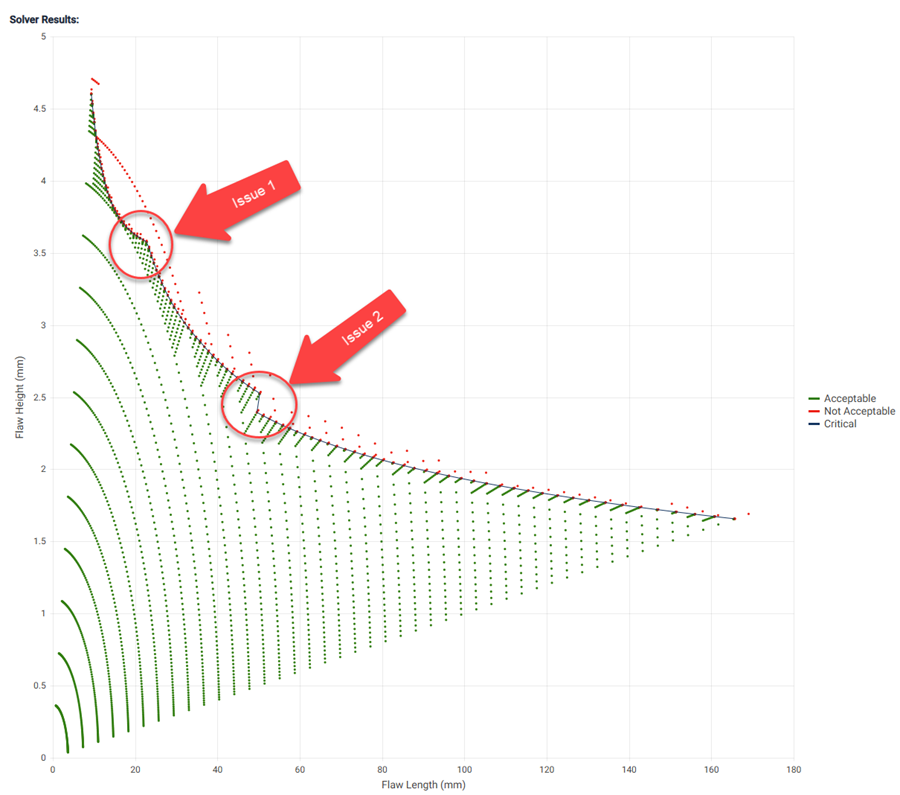
Unfortunately, some BS 7910 solutions are not continuous, so sometimes the Critical Flaw Curve produced by the Solver is not smooth and / or is not continuous. This issue is more common for Fracture Components than others. The following figure illustrates Solver Results of a Fracture Component showing two such issues. Material ECA makes it easy to investigate and understand these “Odd Solver Results”. Issue 1 is associated with an abrupt change in the slope of the critical flaw curve: for smaller flaw lengths, the critical point on the crack is the surface (0 degrees), and for larger flaw lengths the critical point on the crack is the deepest (90 degrees). Issue 2 is associated with a change in the Mk solution used: for smaller flaw lengths, the 3D Mk solution is used, and for larger flaw lengths the 2D Mk solution was used, as the 3D Mk solution is not valid for surface flaws having a flaw ratio (flaw length to flaw height) larger than 20. Methods and tools Material ECA provides to investigate and understand Solver results are discussed later in this article.
This article uses the Fracture Component created in the BS 7910 Fracture Component article. If you are not familiar with that Component, we recommend reading that article before this one.
It is expected that Material ECA users are appropriately familiar with and can reference their own copy of BS 7910, and they are proficient with applicable fitness-for-service or ECA assessment methods and recommended practices. Please contact us if you have any questions or concerns. Our contact information is available at Material Energies.com/contact-us.
Running the Solver and Viewing the Results
Open any existing Fracture Component or create a new one, scroll to the bottom, and click the Run Solver button.

The Solver Settings form appears with the following options:
- Solver Resolution: Normal or High. Normal resolution produces 25 Critical Flaws, and High Resolution produces 100 Critical Flaws.
- Solver Units: choose between mm or inches.
- Embedded Flaws check box. Check to assess embedded flaws.
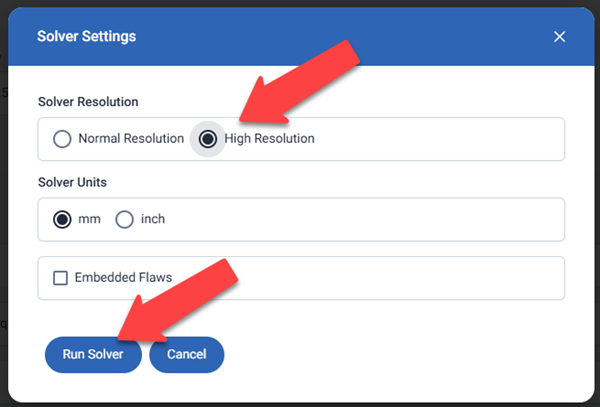
For this example, select High Resolution, mm units, and leave the Embedded Flaws check box unchecked, as shown in the following figure. Click the Run Solver button.
Navigate to the Results page by clicking Results on the menu on the left side, as shown here.
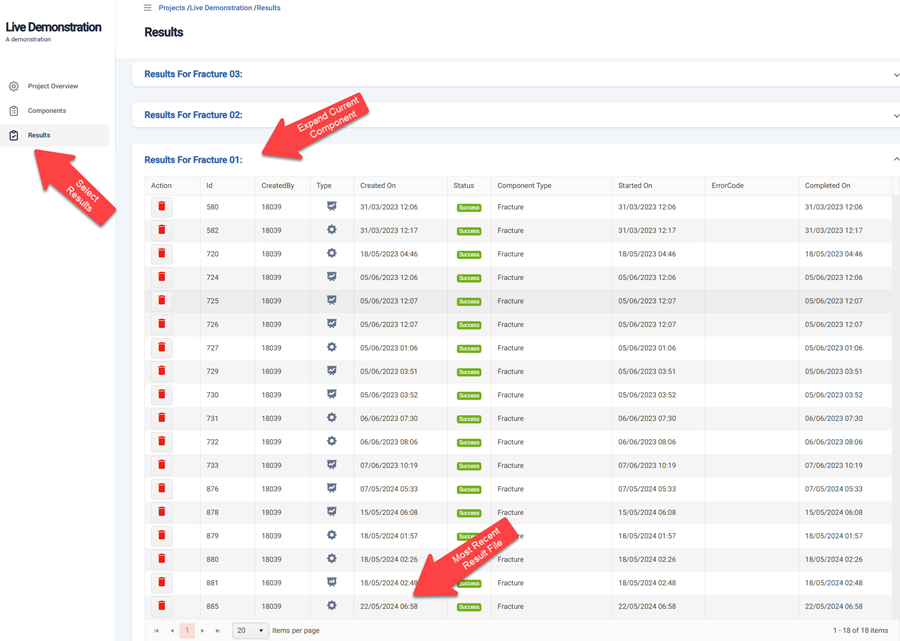
The Results page organizes all the results by Component. Expand the current Component to view all results for that Component. Open the desired Result by clicking anywhere on the row.
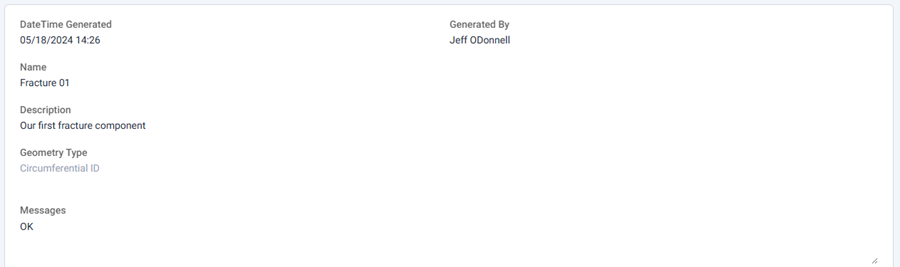
The header for the Solver Results page, shown below, provides summary information, including when the Results were run, who produced the Results, the Component name, the Component description, Geometry Type, and messages. If the Solver encountered an error, it provides a message describing the error, if ran successfully it returns “OK”.
The body of the Solver Result, shown below is an interactive chart of all flaws assessed as flaw height vs flaw length. As mentioned earlier, the Critical Flaws are those on the line separating the Acceptable Flaws and the Not Acceptable Flaws. Hovering the mouse pointer over any point reveals details about the point. Clicking an item on the Legend toggles the visibility of that item on and off. It’s helpful to toggle off the Acceptable and Not Acceptable items to reveal details about the Critical Flaws.

Below the chart, are the buttons View Component, Export As JSON, and Export As Excel. Clicking the View Component button will return the view to the input data for the current Component. Clicking the Export As JSON button formats the results as JSON, prints it to a text file, and exports it to the local computer. Clicking the Export As Excel button produces a Microsoft Excel file and exports it to the local computer. The Export features are discussed in more detail later in this article.
These Solver Results were set for High Resolution, so 100 Critical Flaws are assessed. The following chart illustrates Solver Results set to Normal Resolution. In Normal Resolution 25 Critical Flaws are assessed. For both options, the Critical Flaws have an accuracy of 0.001mm relative to flaw height (a or 2a).

Running the Solver for Corner Flaws in Plate and Straight Flaws in Rounds
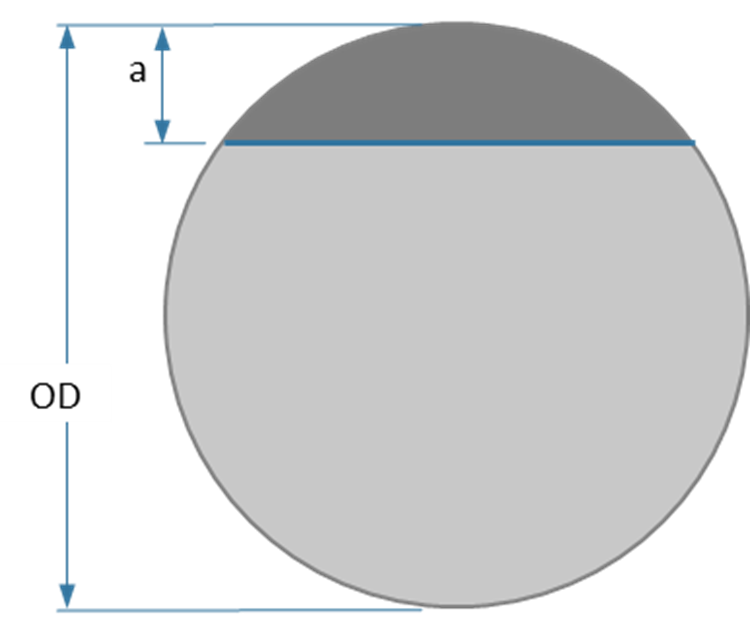
The following figures illustrate the corner flaws in plate and straight flaws in rounds Geometry Types.
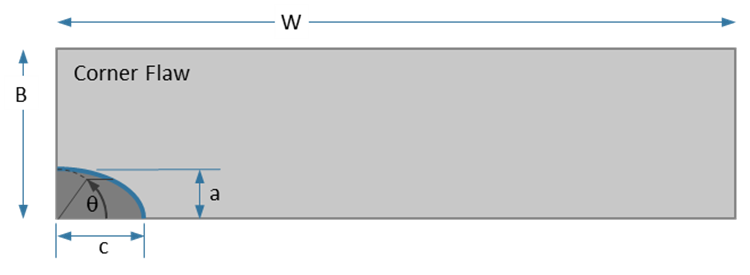
The Solver Results for the two Geometry Types have the following differences:
- Neither of the two can assess embedded flaws
- For corner flaws in plate, the range of flaw length to flaw height ratios assessed is 2 to 5
- For straight flaws in rounds, the flaw is assessed as one dimensional and has only a flaw height parameter, with the flaw length dependent on the diameter of the round section and the flaw height. As such, the Solver Results chart is not meaningful.
The following is a typical Solver Results chart for a Component having a Geometry Type of Plate Corner.

Running the Solver for Embedded Flaws
Assessing the Critical Flaws for embedded flaws is done the same way as for surface flaws. However, on the Solver Settings form, select the Embedded Flaw check box, and a Flaw Ligament input box appears. Input the desired Flaw Ligament noting the selected units and click the Run Solver button. The Solver uses the input Flaw Ligament size as the initial Flaw Ligament for every flaw assessed.

Solver Results for an Embedded Flaw are illustrated below.

Exporting Solver Results as an Excel File
Exporting Solver Results as an Excel File enables custom fast and easy post processing and charting of solver results.
When viewing the Solver Results, scroll to the bottom and click the Export As Excel button.

Material ECA creates a Microsoft Excel file that contains the Solver Results and exports it to the Downloads folder on the local computer (depending on local settings). Locate the file and open it.

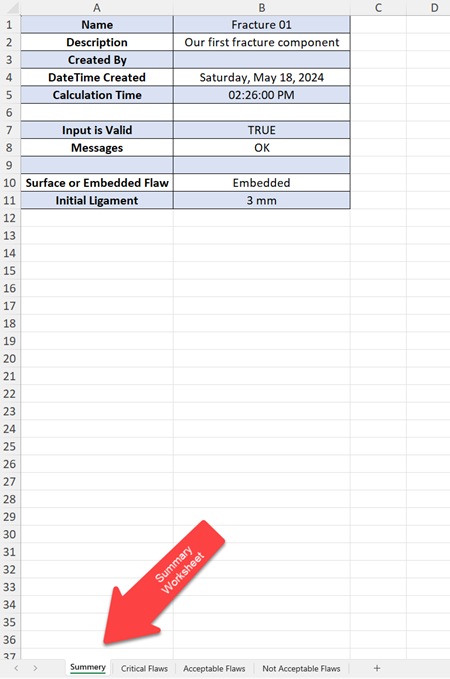
As shown in the following figure, the Solver Results Excel file has four Worksheets. The Summary Worksheet contains the information provided in the Header.
The Critical Flaws Worksheet contains the list of the Initial and Final Critical Flaws. Because these are Solver Results from a Fracture Component which has no flaw growth, the initial and final flaws are the same. For Solver Results from Fatigue or Ductile Tearing Components which have flaw growth, or Chain or Group Components that contain Fatigue and/or Tearing Components, the initial and final flaws are different.

The Acceptable Flaws Worksheet contains the list of the Initial and Final Flaws that are assessed to be Acceptable.

The Not Acceptable Flaws Worksheet contains the list of the Initial and Final Flaws that are assessed to be Not Acceptable.

Exporting Solver Results as a JSON File
Exporting Solver Results as a JSON File enables custom post-processing or imported by other digital platforms. Data formatted as JSON is quickly and easily read by most modern general-purpose programming languages and is commonly used to interchange data between digital platforms.
When viewing the Solver Results, scroll to the bottom and click the Export As JSON button.

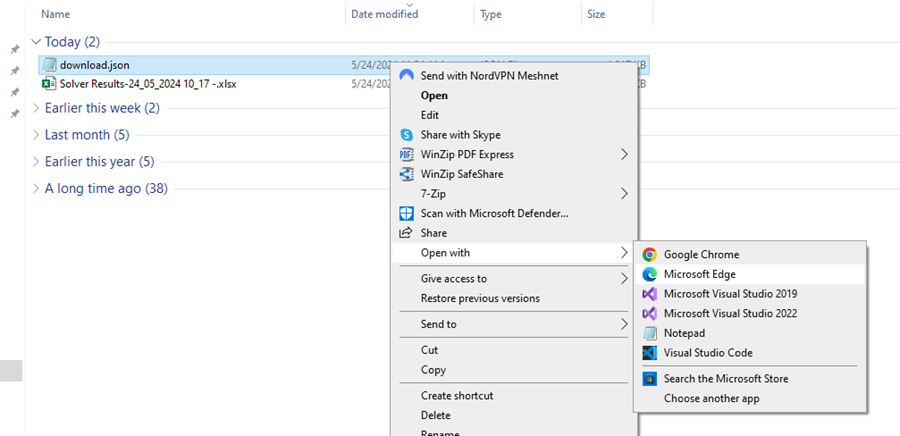
Material ECA creates a text file that contains the Solver Results formatted as JSON and exports it to the Downloads folder on the local computer (based on local settings). Locate the file, right click it, and Open With the browser of your choice.
There are many ways to view JSON files. In this example, I open the JSON file using Microsoft Edge, which has the extension JSON Formatter engaged. The JSON Formatter extension makes it easy to read the data, and it can expand or collapse objects and arrays to manage large data sets, such as the array of Assessed Flaws, which in this example has 3557 items.
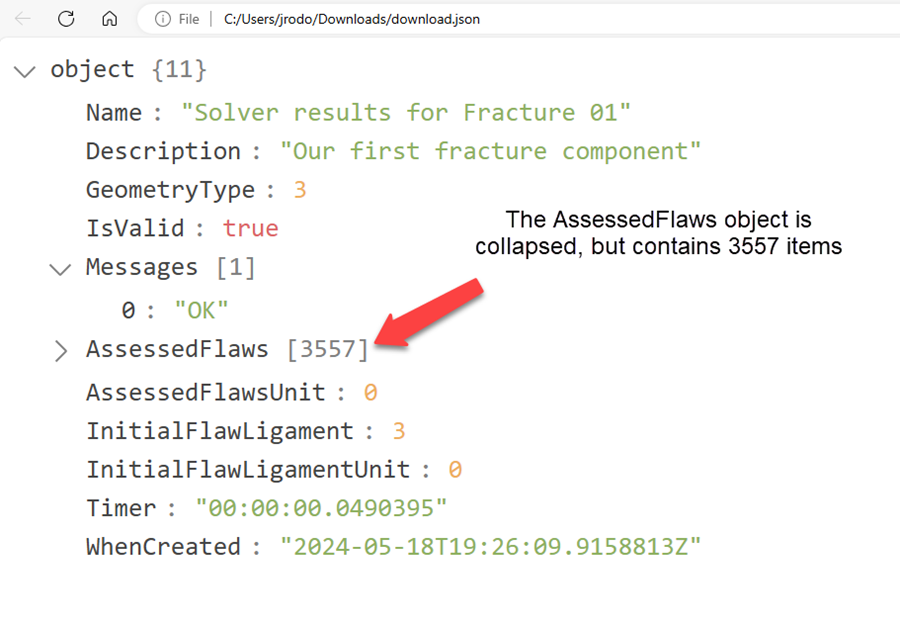
Notice the Timer item shows the calculation took 49 milliseconds to complete all 3557 calculations. The Material ECA Solver processes the results in parallel, taking advantage of all cores and threads available in the workstation. For Fracture Components, it takes more time to transfer data than it does to do the calculation.
Expanding the AssessedFlaws array exposes the data available for each. As shown here, the data includes if the flaw is acceptable, if the input data is valid, if the flaw is critical, the initial flaw height, length, and ligament, the final flaw height, length, and ligament, and the critical flaw angle. This data is available for all 3557 assessed flaws.

How The Solver Works
The Material ECA Solver does an inspection of the Component being assessed and tunes the Solver by setting some internal parameters. Then it creates an array of flaw ratios (flaw length to flaw height) between 2 and 100. For Normal Resolutions, 25 ratios will be created, and for High Resolution, 100 ratios will be created. For each ratio, an initial flaw is created and assessed. That initial flaw is substantially smaller than the critical flaw for that flaw ratio. When the flaw is acceptable, the next initial flaw is created having the same flaw ratio but is larger by a set amount than the first and it is assessed. This continues until the initial flaw is not acceptable, then the next initial flaw is set to the last acceptable flaw and incremented larger by 10% of the original set amount and it is assessed. This is repeated until the set amount to increment is smaller than desired accuracy. The largest Acceptable Flaw for each flaw ratio is set as the Critical Flaw. Each ratio is calculated like this in parallel.
A Discussion About Non-Unique Solutions and Other “Odd Solver results”
Earlier this article described how some BS 7910 solutions are not continuous and produce critical flaw curves that are not smooth and/or not continuous. Also, BS 7910 clause 7.4.3 describes the potential for BS 7910 methods to produce non-unique solutions, which is when a flaw of one size is acceptable, but a flaw of a smaller size is not acceptable. The Material ECA Solver in part addresses this concern by assessing many acceptable flaws and presenting those plotted on the flaw height vs flaw length chart, providing confidence that the smallest flaw that’s not acceptable is identified. Software automating BS 7910 methods provided by others produce a similar chart by calculating either the critical flaw height as a function of flaw length, or the critical flaw length as a function of flaw height. Using one of these methods can obscure non-unique solutions. Instead, Material ECA calculates the critical flaws using the ratio of flaw length to flaw height, which more easily identifies these non-unique solutions, so they can be handled appropriately. Finally, sometimes the critical flaw line on the flaw height vs flaw length chart is just “odd” – it looks unusual or unexpected. For example, sometimes portions of the line have a positive slope, which is inconsistent with fundamental fracture mechanics theory. When this happens, it’s usually due to simplifications and/or conservative assumptions built into the BS 7910 solutions. They should be investigated and understood appropriately by personnel well-versed with the type of assessment and BS 7910.
This section discusses three examples and shows how Material ECA can be used to investigate and understand the results so they can be handled appropriately. Our first example is the results discussed earlier. It has two issues as illustrated here:

Example 1 is for a circumferential ID surface flaw in a 22-inch OD pipe with a 17mm wall. The Km is set to 1.2, the attachment length (L) is set to 17mm, and the option to use the 3D Mk solution is selected. The material is API 5L X65, and the tensile properties are set to the minimum specified values. The toughness is set to 0.25mm CTOD. The option to use the M.7 solution is selected; however, it is not used since the conditions are not satisfied. Weld residual stresses can relax, and the Option 1 Continuous failure assessment diagram is selected.
On the chart in the Solver results, issue 1 can be identified by hovering the pointer over the critical points on both sides of abrupt change in slope. This displays information about the points, including the critical flaw angle. The critical angle changes from 0 degrees (the surface point) to 90 degrees (the deepest point) here. This is a common issue. It can be understood by considering two curves that intersect at the change in slope. One curve is associated with the surface point, and the other is associated with the deepest point. Both curves would continue past the point of intersection, but those are not critical.
Issue 2 is a discontinuity – there is a step change lower in critical flaw height as flaw length increases. Hovering the point over the critical points on either side of issue 2 shows that the critical flaw angle does not change. However, the flaw length to flaw height ratio is approximately 20. Since we know the current Component selected the 3D Mk solution, but it is not valid for flaw ratios larger than 20, we can suspect that this discontinuity might be caused by the change of Mk solution from the 3D to 2D solution. The Mk solutions are described in BS 7910 Annex M.11.1. To confirm this, detailed results for the two critical flaws on either side of the discontinuity need to be reviewed. Obtain the detailed results by running the current Component twice, once using each of the two critical flaws. See the parameter “Mk Is 3D” changes from “true” for the smaller flaw to “false” for the larger flaw, and the value for Mkm at the deepest point (the critical angle was 90 degrees) increases markedly. This issue can be understood by again considering two curves that stop on either side of the discontinuity. One curve is associated with the 3D Mk solutions, and it stops when the flaw length to flaw height ration exceeds 20, because it is no longer valid. The other curve is associated with the 2D Mk solution, and it stops when the 3D Mk solution becomes valid, because that was option selected, but it could extend to smaller flaw sizes and remain valid.
The second example is illustrated here.
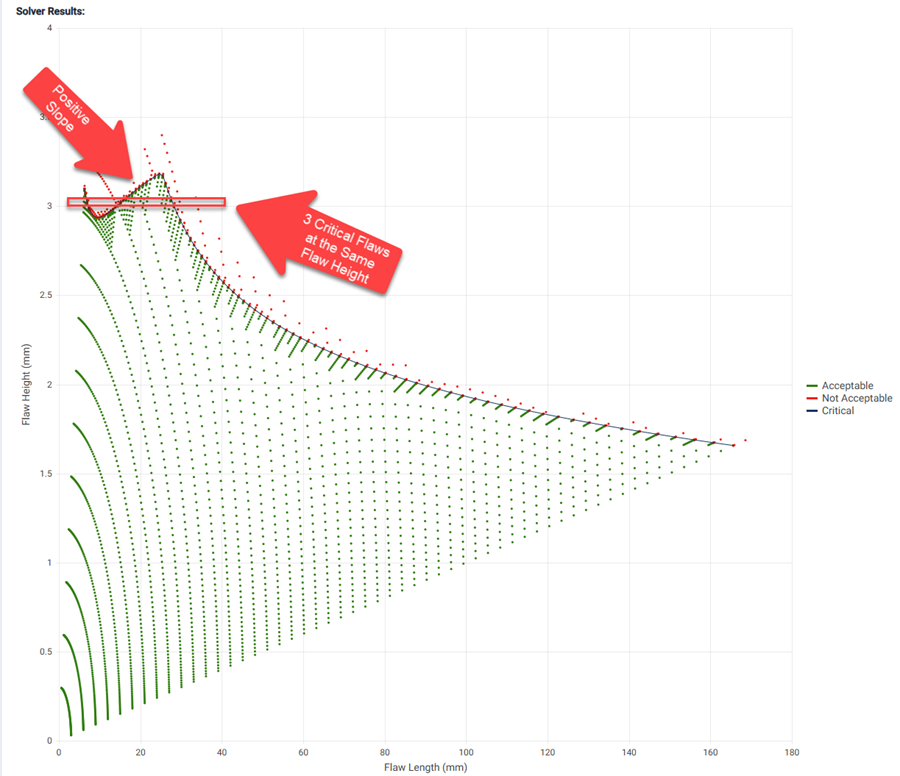
Example 2 is the same Component used for Example 1, except the option to use the 3D Mk solution was not selected.
In this example we can see there is a portion of the Critical Flaw curve that has a positive slope, which is odd. We can also see that there are non-unique solutions: when the flaw height is approximately 3mm, there are three critical flaw lengths.
The following chart shows the two critical flaw lines from Examples 1 and 2, together. When the flaw ratio is larger than 20, the two curves use the 2D Mk solution, so they produce the same curve; otherwise, the curve from Example 1 is associated with the 3D Mk solution and produces larger critical flaws. BS 7910 Annex M.11.1 describes the two solutions. In general, the 2D Mk solution was developed based on 2D finite element modelling, and the 3D Mk solution was developed based on 3D finite element modelling. For 2D Mk solutions, the flaw length is essentially assumed to be infinitely long in every instance, so it is expected to be conservative relative to the 3D Mk solutions. This explains why the Critical Flaws using the 3D Mk solution are larger and more accurate than those using the 2D Mk solution. In general, the 2D Mk solution can be overly conservative when the critical location is the surface point (flaw angle of 0 degrees).

It is generally preferred to use the 3D Mk solution whenever possible. Commonly the attachment length (L) is assumed to be no smaller than 50% of the wall thickness to stay within the validity limits of the 3D Mk solution while remaining conservative. Otherwise, the critical flaw curve may be conservatively “processed” to remove the positive slope and non-unique solutions as shown in the following chart:

The third example is illustrated here.
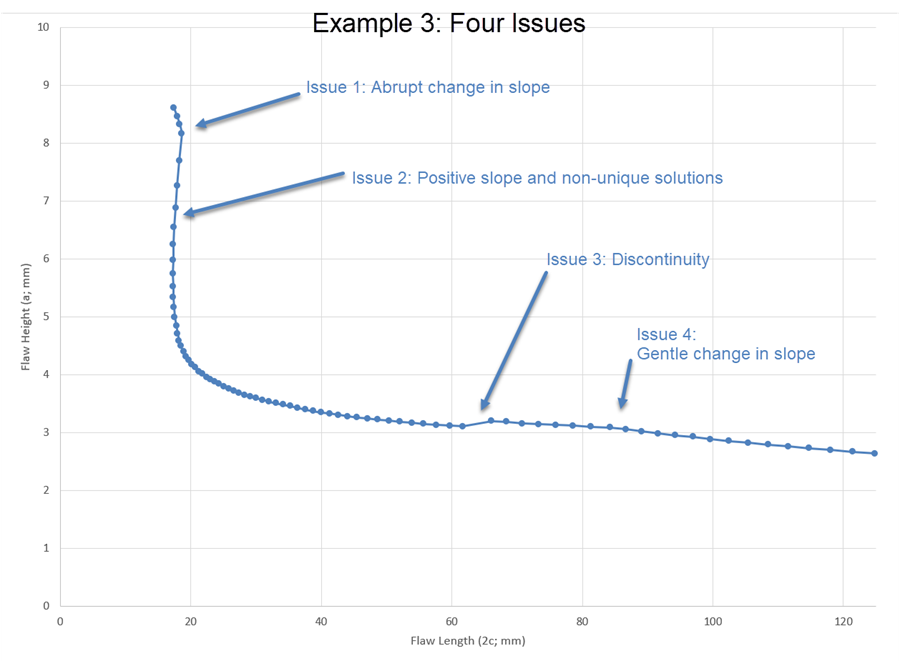
Example 3 is for a circumferential ID surface flaw in a 10.75-inch OD pipe with a 20mm wall. The Km is set to 1.2, the attachment length (L) is set to 0, so the Mk parameters are set to 1.0. The material is API 5L X65, and the tensile properties are set to the minimum specified values. The toughness is set to 0.10mm CTOD. The primary membrane stress (Pm) is set to 350 MPa, and the primary bending stress (Pb) is set to 25 MPa. The option to use the M.7 solution is selected, weld residual stresses can relax, and the Option 1 Continuous failure assessment diagram is selected.
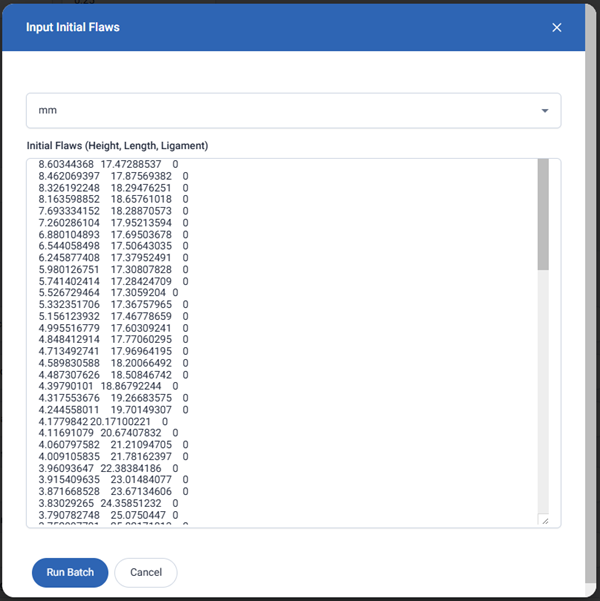
Export the Solver Results to Excel, open the file, and copy the Critical Flaws. Return to the Component, scroll to the bottom, and click the Run Batch button. Paste the Critical Flaws into the Initial Flaws input box in the Input Initial Flaws form and click Run Batch, as shown in the following figure. This procedure is described in the BS 7910 Fracture Component article.
Navigate to the Results page and open the Batch Results. The following figure shows the Failure Assessment Diagram that results. The 100 assessed flaws reside on the Failure Assessment Line, as expected. It’s worth noting that the assessment points straddle Lr = 1.0 where the slope of the failure assessment line is discontinuous.
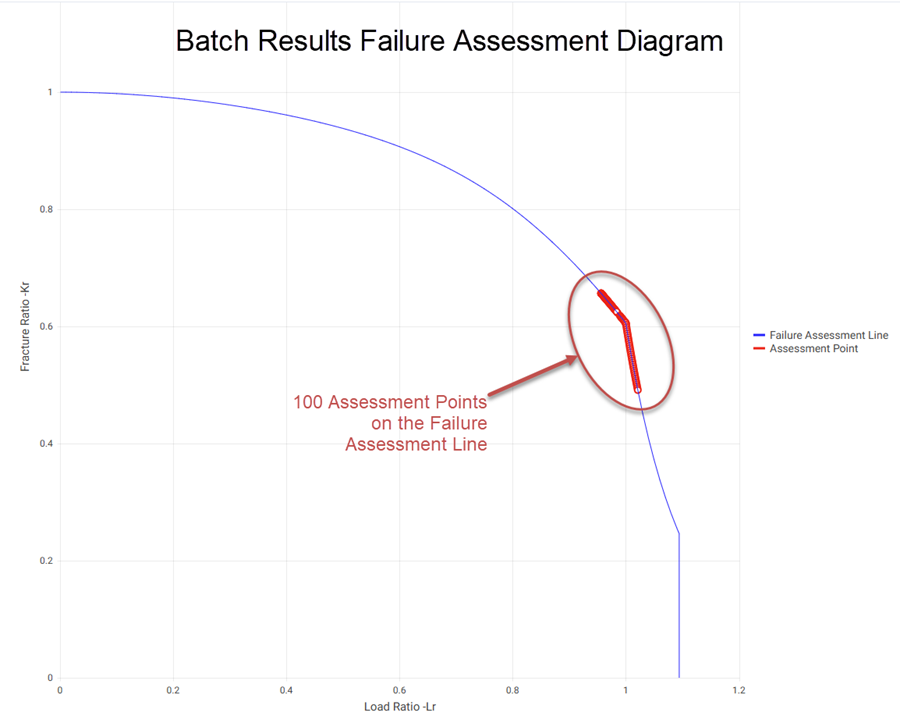
Scroll down to view the Fracture Batch Item Results table (below), which lists some details about the flaws assessed. The flaws are listed in order as plotted on the flaw height vs flaw length chart from the top left to the bottom right. Notice the Flaw Angle column shows the first 3 rows have values of 0 degrees and the subsequent points have values of 90 degrees. Also, the Lr column shows the first 3 rows have values larger than 1.0, and subsequent points have values less than 1.0. Both these two changes occur at what we identified as Issue 1 and explain the abrupt change in slope.

At the bottom of the table, change the number of items per page to 100 to reveal all assessed flaws, and scroll down (figure below). In the Annex M column, notice the rows having flaw lengths larger than 62 use a different Annex M solution. The M.7.3.2 solution is not valid when the flaw ratio (flaw length to flaw height) exceeds 20, so the alternative solution is used. This explains the discontinuity associated with Issue 3. Furthermore, notice the rows having flaw lengths larger than 84.22 have Lr values larger than 1.0, which is associated with the discontinuity in the slope of the failure assessment line. This explains the gentle change in slope associated with Issue 4.

To explore and understand the positive slope and non-unique solution associated with Issue 2 refer to the next figure, which focusses on that region. Notice there are 3 critical flaw height values associated with a flaw length of approximately 18mm. Other software automating the methods of BS 7910 can calculate the smallest critical flaw height as a function of flaw length, and the positive slope will be obscured. Some software can calculate the critical flaw length as a function of flaw height. The results from both those calculations need to be combined to obtain the Solver Results produced by Material ECA.

Select point 6 and create point 6+, which has the same length as point 6, but its height is 0.2mm larger. Do the same for points 10, 13, and 17 to create points 10+, 13+, and 17+. Run the Component with each of these as initial flaws and export the results to the local computer as Excel files.
Because flaws associated with points 6, 10, 13, and 17 are critical, increasing the flaw height by any amount should be expected to make the flaw unacceptable. As shown on this figure, this is true for flaws associated with points 13 and 17, as points 13+ and 17+ are in the Not Acceptable Region. However, this is not true for flaws associated with points 6 and 10, as point 6+ and 10+ are in the Acceptable Region.
The following table was produced from the detailed results exported as Excel files above.
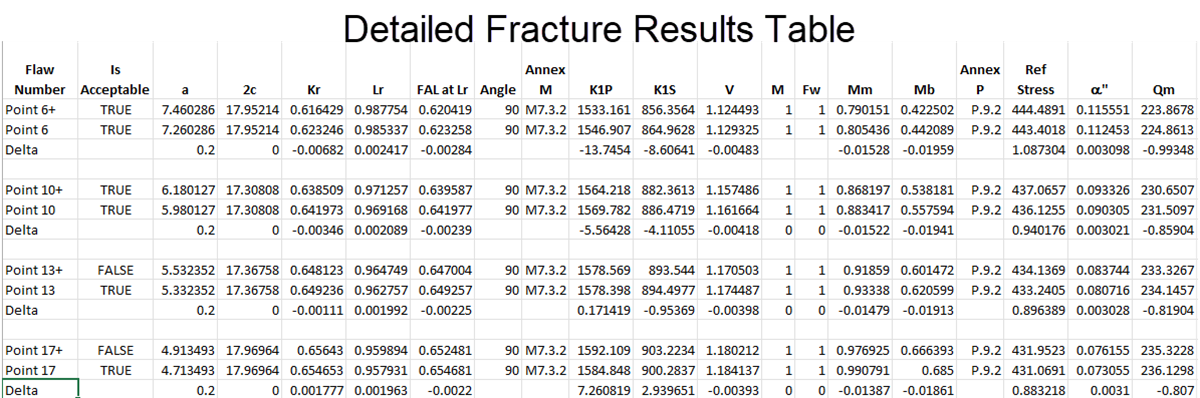
We can see that the critical flaw angle is 90 degrees for all, and the Annex M and P paragraphs used are the same for all, so those don’t explain the issue.
Focusing on the rows for Points 6 and 6+, we see that increasing the flaw height increases the reference stress (ref stress) and a”, which make sense. We confirm increasing the reference stress increases the load ratio (Lr) and decreases the secondary stress (Qm), because the weld residual stresses will be further relaxed, as expected. We confirm the increase in the load ratio (Lr) decreases the value of the failure assessment line at the Lr value (FAL at Lr), because the failure assessment line has a negative slope, as expected. However, we notice the fracture ratio (Kr) decreases when the flaw height is increased, which is notable. Indeed, we notice the Kr value decreases more than the FAL at Lr value does, which explains why the flaw associated with point 6+ is acceptable. Looking further, we notice that the stress intensity factors associated with primary (K1P) and secondary (k1S) stresses decrease. K1S might be expected to decrease because Qm decreased, but it’s curious that K1P decreases. K1P is dependent on the parameters M, fw, Mm, and Mb, and M and fw factors have not changed. Mm, however, decreases. For BS 7910 Annex M.7.3.2, Mm is dependent on three parameters: a/c, a/B, and B/ri. The two parameters a/c and a/B both increase when flaw height increases. In this case, when a/B increases, Mm increases, and when a/c increases, Mm decreases. It is easily confirmed that for the flaw associated with point 6, the increase in a/c governs, so the Mm value indeed decreases.
Comparing Points 6 and 6+ with the others, a trend appears. When the flaw heights of Points 10, 13, and 17 are incrementally increased, the amounts that the Kr values decrease are incrementally smaller; the Kr value of Point 17 actually increases.
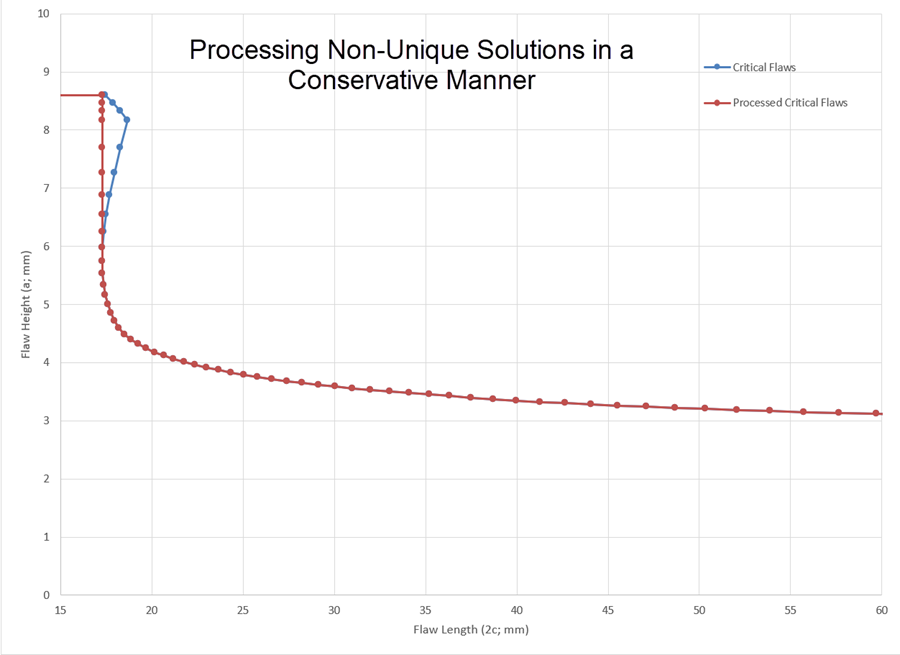
The following figure shows a way to process the Solver Results in a way to handle the non-unique solutions that comes along with the positive slope in a way that should be conservative
To wrap-up this discussion on non-unique and “odd” solver results, BS 7910 is widely accepted as safe and reliable. However, when used for fitness-for-service or ECA assessments, the consequences of mistakes can be severe. Under such situations, we at Material Energies recommend having independent experts in such assessments and with such applications review and confirm assessments.
Next Article is The BS 7910 Fatigue Component | A Deep Dive
Last Updated on 29 May 2024